

How to improve ROAS without increasing ad spend
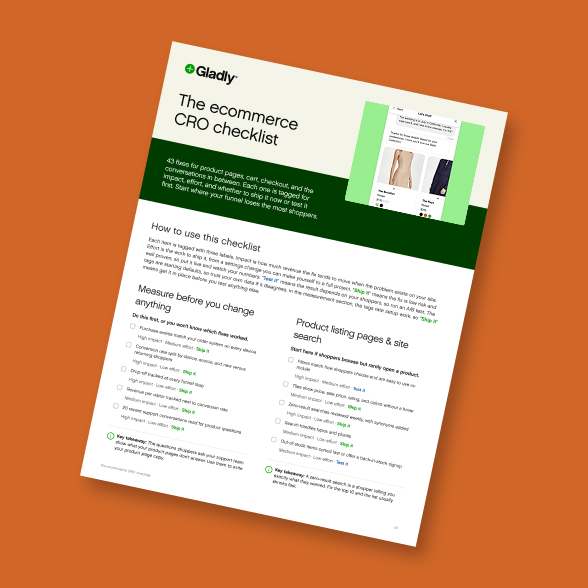
The ecommerce CRO checklist
43 conversion fixes across product pages, cart, checkout, and shopper conversations, each ranked by impact and effort so you know what to ship and what to test.

Updated: 10/16/26
ROAS (return on ad spend) is the revenue your ads bring in divided by what you spent on them. There are two ways to raise it. You can pay less for each click, or you can get more revenue out of each click you already paid for. Most advice on improving ROAS works on the first, with tighter targeting, smarter bids, and fresher creative. The second is usually where the cheaper gains are, because conversion rate, order value, returns, and repeat orders all change the revenue side without touching your budget.
This guide breaks ROAS into the parts you can work on, using one fictional apparel brand so you can see how each change moves the number. It also covers the two adjustments ad platforms leave out: returns and second orders.
What ROAS tells you, and what it doesn’t
ROAS = revenue attributed to ads ÷ ad spend. A brand that spends $30,000 on ads in a month and gets $54,000 in attributed sales has a ROAS of 1.8, sometimes written as 180% or 1.8:1.
That number tells you how much revenue your ads produced for each dollar. It doesn’t tell you whether you made money, because it ignores what the products cost you. It also counts the gross sale, so an order that gets returned next week still sits in your ROAS.
Breakeven ROAS
Breakeven ROAS is the point where ad-driven sales cover the cost of the products and the ads, with nothing left over:
Breakeven ROAS = 1 ÷ gross margin
Our apparel brand sells at an $80 average order value with a 50% gross margin, so each order leaves $40 after the cost of goods. Its breakeven ROAS is 1 ÷ 0.5 = 2.0. At a ROAS of 1.8, it’s losing money on its ads, even though the dashboard shows $1.80 coming back for every dollar.
If you also pay for shipping, payment processing, and packaging on every order, subtract those from your margin before you do the division. A brand with a 40% margin after all of that has a breakeven ROAS of 2.5.
What a good ROAS looks like
A good ROAS is one comfortably above your breakeven. Benchmarks can tell you whether you’re in a normal range for your category. Triple Whale’s 2026 ecommerce benchmarks put ROAS for August 2025 through July 2026 at 2.70 for Apparel and Accessories, 1.82 for Beauty, and 2.72 for Home and Garden, with Automotive at the top of the range (3.27) and Health and Wellness near the bottom (1.55).
Two brands at the same 2.7 ROAS can have very different results. At a 60% margin, 2.7 is healthy. At a 30% margin, breakeven is 3.3, and 2.7 loses money on every order.
The ROAS formula, broken into levers you can pull
Revenue is clicks × conversion rate × average order value, and spend is clicks × cost per click. The clicks cancel out, which leaves:
ROAS = conversion rate × average order value ÷ cost per click
Here’s the apparel brand’s month:
Ad spend: $30,000
Cost per click: $0.80, so 37,500 clicks
Conversion rate: 1.8%, so 675 orders
Average order value: $80, so $54,000 in revenue
ROAS: 0.018 × $80 ÷ $0.80 = 1.8
Now change one input at a time and keep spend at $30,000:
How each input moves ROAS on the same $30,000
Scenario | What changed | ROAS |
|---|---|---|
Starting point | 1.8% conversion, $80 order value, $0.80 per click | 1.8 (below the 2.0 breakeven) |
Higher conversion rate | Conversion rate from 1.8% to 2.2% | 2.2 |
Higher order value | Average order value from $80 to $88 | 1.98 |
Both | 2.2% conversion and $88 order value | 2.42 (comfortably above breakeven) |
None of those changes needed a bigger budget or a cheaper click. When your ROAS slips, check which of the three inputs moved before you start rebuilding campaigns. A rising cost per click is a media problem. A falling conversion rate or order value usually starts on your site.
The ROAS formulas, in one place
ROAS = ad revenue ÷ ad spend. Breakeven ROAS = 1 ÷ gross margin. ROAS = conversion rate × average order value ÷ cost per click. To work on the conversion side, the ecommerce CRO checklist covers 43 fixes rated by impact and effort.
Cut wasted spend before you cut the budget
The cost side still matters, and the fastest wins there come from cutting spend that isn’t adding revenue. A few places to look:
Prospecting campaigns that reach existing customers. Upload your customer list as an exclusion audience on prospecting campaigns, so you’re paying to find new buyers. Retargeting and retention campaigns can still reach existing customers on purpose.
Branded search. Shoppers who type your brand name were probably going to find you anyway. Pause branded ads in one region for a few weeks and compare sales there with the rest of the country. If they barely move, that budget can go somewhere it changes the outcome.
Retargeting with no frequency cap. Someone who has seen the same ad 15 times this week isn’t going to buy because of the 16th. Cap frequency and shorten the window for people who viewed a product once and left.
Out-of-stock and low-margin products. Pause ads for products that are sold out or nearly sold out in popular sizes, and move spend away from items whose margins can’t clear your breakeven ROAS.
Tired creative. When click-through rate on an ad set drops week over week while spend holds steady, the audience has seen it too many times. Refresh it before the platform starts charging you more for each click.
Raise conversion rate after the click
Every click you’ve paid for either becomes an order or doesn’t, and most of what decides that happens on your site. Start with the page the ad sends people to. It should show the product or offer from the ad, at the price in the ad, and load quickly on a phone. If the ad is for a specific jacket, send people to that jacket, because a category page makes them go looking for it again. Our ecommerce landing page optimization checklist covers what to check on that page before a campaign goes live.
Next, look at what stops people at checkout. In a 2024 Baymard Institute survey of US adults, 48% said extra costs like shipping, tax, and fees were the reason they abandoned an online cart. Show shipping costs and your returns policy on the product page, so nobody meets them for the first time at the last step. Our guide on how to reduce cart abandonment goes through the checkout fixes in order.
Then there are the questions shoppers can’t answer from the page. Will this run small? Does it come in a longer length? Will it arrive before the 20th? A shopper who came from an ad and can’t get an answer will usually leave, and that click is spent either way. An AI shopping assistant can answer those questions on the page, while the shopper is still deciding.
That’s the gap Balsam Hill closed with Gladly. Its product answers existed but were hard to find, and a separate shopping bot confused customers who also needed help with orders. With Gladly handling shopping and service in one conversation, nearly one in five shoppers who viewed a product in chat added one to their cart in the first 30 days.
When people think of Balsam Hill, we want them to think of joy. Two competing experiences on the website are not very likely to create joy.
Joe Balczo
Senior Strategist for AI and CX Technology, Balsam Brands
To go further on this lever, our ecommerce conversion rate optimization framework covers how to find where shoppers drop off and how to test fixes, and our post on what counts as a good ecommerce conversion rate helps you set a realistic target.
Try Gladly AI right here
Paying for clicks that don’t convert? Ask Gladly AI.
Gladly AI already answers shoppers on brand sites. Ask it how it would handle yours.
Raise order value without eating your margin
Order value is the lever people reach for with discounts, and discounts work against ROAS in a way that’s easy to miss. Say the apparel brand runs 10% off sitewide. Its $80 order becomes $72 while the cost of goods stays at $40, so the margin drops from 50% to 44%. Breakeven ROAS rises from 2.0 to 2.25, so the brand needs better ad results just to stay level.
These raise order value and leave margin alone:
A free-shipping threshold set a little above your current average order value. Shoppers who are close will add something small to reach it. Check that the extra items are worth more than the shipping you’re absorbing.
Bundles of products people already buy together. Pull the pairings from your order history instead of guessing, and use a product bundling strategy that keeps each bundle’s margin intact.
Recommendations at the moment of choice. A shopper asking which belt goes with the boots in their cart is ready for a suggestion, and AI can raise order value without a discount habit by making it right there in the conversation.
For the full list of tactics, see our playbook for increasing average order value.
Returns: the ROAS leak your ad platform doesn’t report
Ad platforms record a purchase when it happens. If the customer sends it back two weeks later, the platform still counts the full sale, so your ROAS reports revenue you’ve already refunded.
The gap can be large. The NRF and Happy Returns 2025 Retail Returns Landscape estimated that shoppers would return 19.3% of online sales in 2025.
Back to the apparel brand, now at a ROAS of 2.42 after its conversion and order value work. If 20% of that revenue comes back as refunds, the revenue it keeps is $72,600 × 0.8 = $58,080. Its return-adjusted ROAS, which we’ll call kept ROAS, is $58,080 ÷ $30,000 = 1.94, which puts it back under its 2.0 breakeven while the ad dashboard still shows a profitable campaign.
Kept ROAS = (ad-attributed revenue − refunds on those orders) ÷ ad spend
To work on it:
Report kept ROAS next to platform ROAS. Match refunds to the orders your ads drove, using order IDs from your store or your attribution tool. Even a store-wide return rate applied to ad revenue is better than ignoring returns.
Find the products and campaigns that bring in returners. A campaign with a high ROAS and a 40% return rate can be worth less than one with a lower ROAS that people keep.
Fix the causes before the sale. Most fit and expectation returns trace back to a question nobody answered: the sizing, the color in daylight, whether it fits a size 11 foot. Better size guides, honest photos, and answers to product questions all cut returns.
Offer exchanges first. An exchange keeps the revenue that a refund would hand back.
Count the second order
ROAS looks at the first purchase. Most of what a customer is worth to a retailer comes after it, and that changes how you should judge ads that bring in new buyers.
Go back to the apparel brand’s kept ROAS of 1.94. Its improved month brought in 825 orders. Suppose 165 of those customers (20%) place a second order within 90 days, at the same $88 average and the same 20% return rate. That’s another $11,616 of kept revenue on the same $30,000 of spend, and the 90-day kept ROAS comes to $69,696 ÷ $30,000 = 2.32. The campaign that looked like a loss on day one has paid for itself by month three.
Track ROAS on more than one window. First-order ROAS shows whether the ad works. A 90-day ROAS shows whether it brought in customers who come back. Two campaigns with the same first-order ROAS can be far apart at 90 days, and the one bringing in returning customers deserves the budget.
The second order depends on how the first one went. A shopper whose package is late, whose size is wrong, or who can’t get a straight answer about a return rarely buys again, however good the ad was. Repeat purchase rate and time to second order are worth watching alongside your ad metrics, since both are among the metrics that predict customer lifetime value. If you’re setting acquisition targets, our guide to calculating customer acquisition cost shows how to judge them against lifetime value and payback in orders.
ROAS vs. MER: read them together
Marketing efficiency ratio (MER) is your total store revenue divided by your total marketing spend, for the same period:
MER = total revenue ÷ total marketing spend
ROAS comes from each ad platform, using that platform’s attribution. MER comes from your store’s books. Each one covers a blind spot in the other.
Platform ROAS can overcount. Meta and Google can both claim the same order, and retargeting and branded search ads collect credit for people who were already on their way to buying. If you add up every platform’s attributed revenue and it’s more than your store booked, that’s what’s happening.
MER doesn’t care who gets credit. If MER holds steady while one platform’s ROAS climbs, that platform is probably claiming sales that would have happened anyway. If MER rises while platform ROAS stays flat, something else is working, like email, organic search, or word of mouth.
Use platform ROAS to decide which campaigns and ad sets deserve more or less budget within a channel. Use MER to decide whether your total marketing spend is paying off. When the two disagree, trust MER for the budget decision and use ROAS to work out where the gap is coming from.
How to know an improvement is real
ROAS moves on its own. A holiday week, a product drop, or an email to your whole list can lift it without anything changing in your ads. Before you credit a change for a better number:
Compare the same kind of period. Compare this November with last November, since October will always look weaker.
Keep the attribution window fixed. Meta defaults to a 7-day click and 1-day view window. If you change it, past and current ROAS stop being comparable.
Use a holdout when the stakes are high. Turn a campaign off in a few regions, or use the lift testing Meta and Google offer, and compare sales with and without the ads. It’s the clearest way to see what a campaign adds.
Check MER and kept revenue. A platform ROAS improvement that doesn’t show up in MER or kept revenue hasn’t helped your business yet.
Where to start
Pull last month’s numbers for your biggest paid channel: spend, clicks, orders, revenue, refunds on those orders, and gross margin. From those you get breakeven ROAS, kept ROAS, and the three inputs to the formula.
Compare kept ROAS with breakeven first. If you’re below it, look at which input is weakest. A cost per click well above your category is a media problem to fix in the ad account. A conversion rate or order value below your category points to the site, and that’s often cheaper to fix than finding new traffic. If you’re above breakeven, check your 90-day ROAS before you scale, so you know the customers you’re buying are worth more than their first order.
Turn more paid clicks into orders
See how Gladly answers shoppers’ product questions on the page, while they’re still deciding.

Frequently asked questions
Recommended reading

How to calculate customer acquisition cost (and know if it paid off)
Learn how to calculate CAC with a worked retail example, then check it against LTV and payback in orders to see if your acquisition spend is paying off.
By
Gladly Editorial

Ecommerce conversion rate optimization, a complete framework
How to run ecommerce CRO as a monthly program: research that feeds a backlog, where to focus first, how to sequence tests, and how to report wins in revenue.
By
Gladly Editorial

How to increase average order value, a practical playbook for ecommerce teams
A practical AOV playbook for ecommerce teams, covering upsells, cross-sells, free shipping thresholds, bundles, mobile fixes, and how to measure lift with RPV.
By
Gladly Editorial